Explainer video — For AI company o9
The purpose of this project was to create an engaging explainer video that would explain from a top level branding perspective about o9 Enterprise knowledge graph. o9 is a software company specialized in enterprise operations using AI to integrate supply chain, commercial, financial planning to better decision making.
The video is a story about how o9 turns data into knowledge that will eventually end in great decision making. The video was used at the homepage for a period of time.
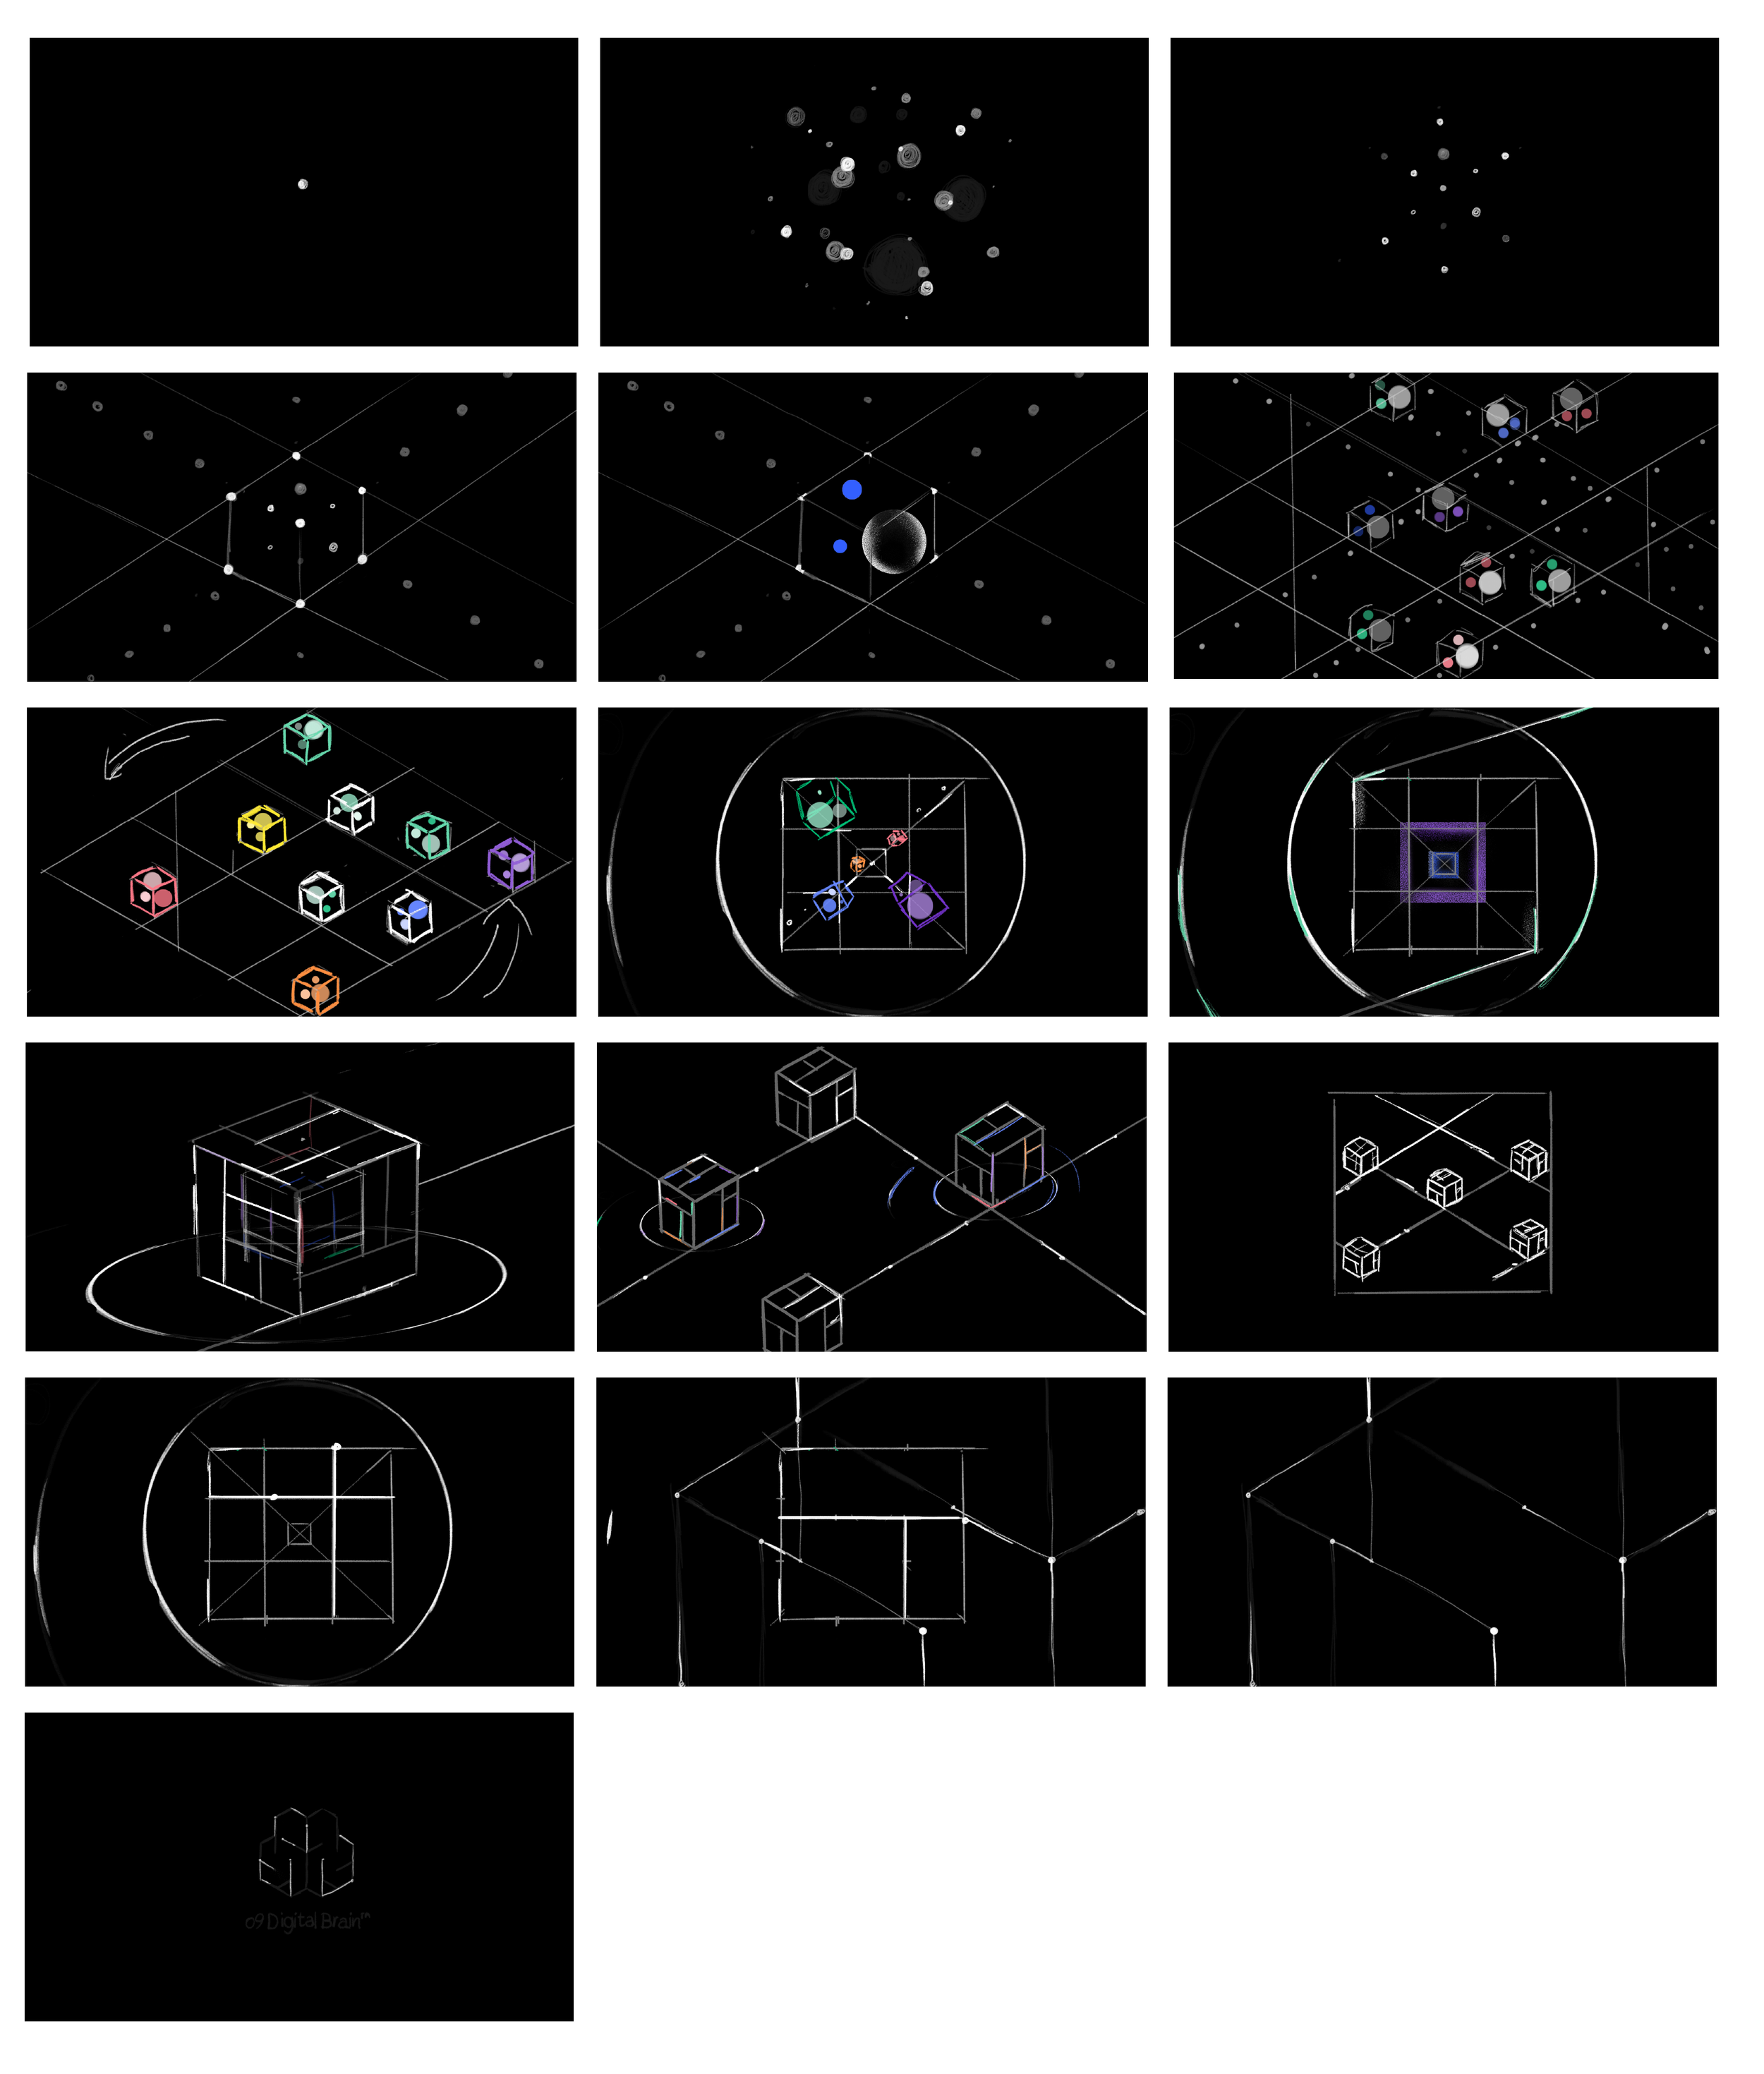
When this project landed un my desk, I was excited to explore and interpret the the brand in a new way! I designed the storyboard and art boards and did the art direction.
The Story and Style
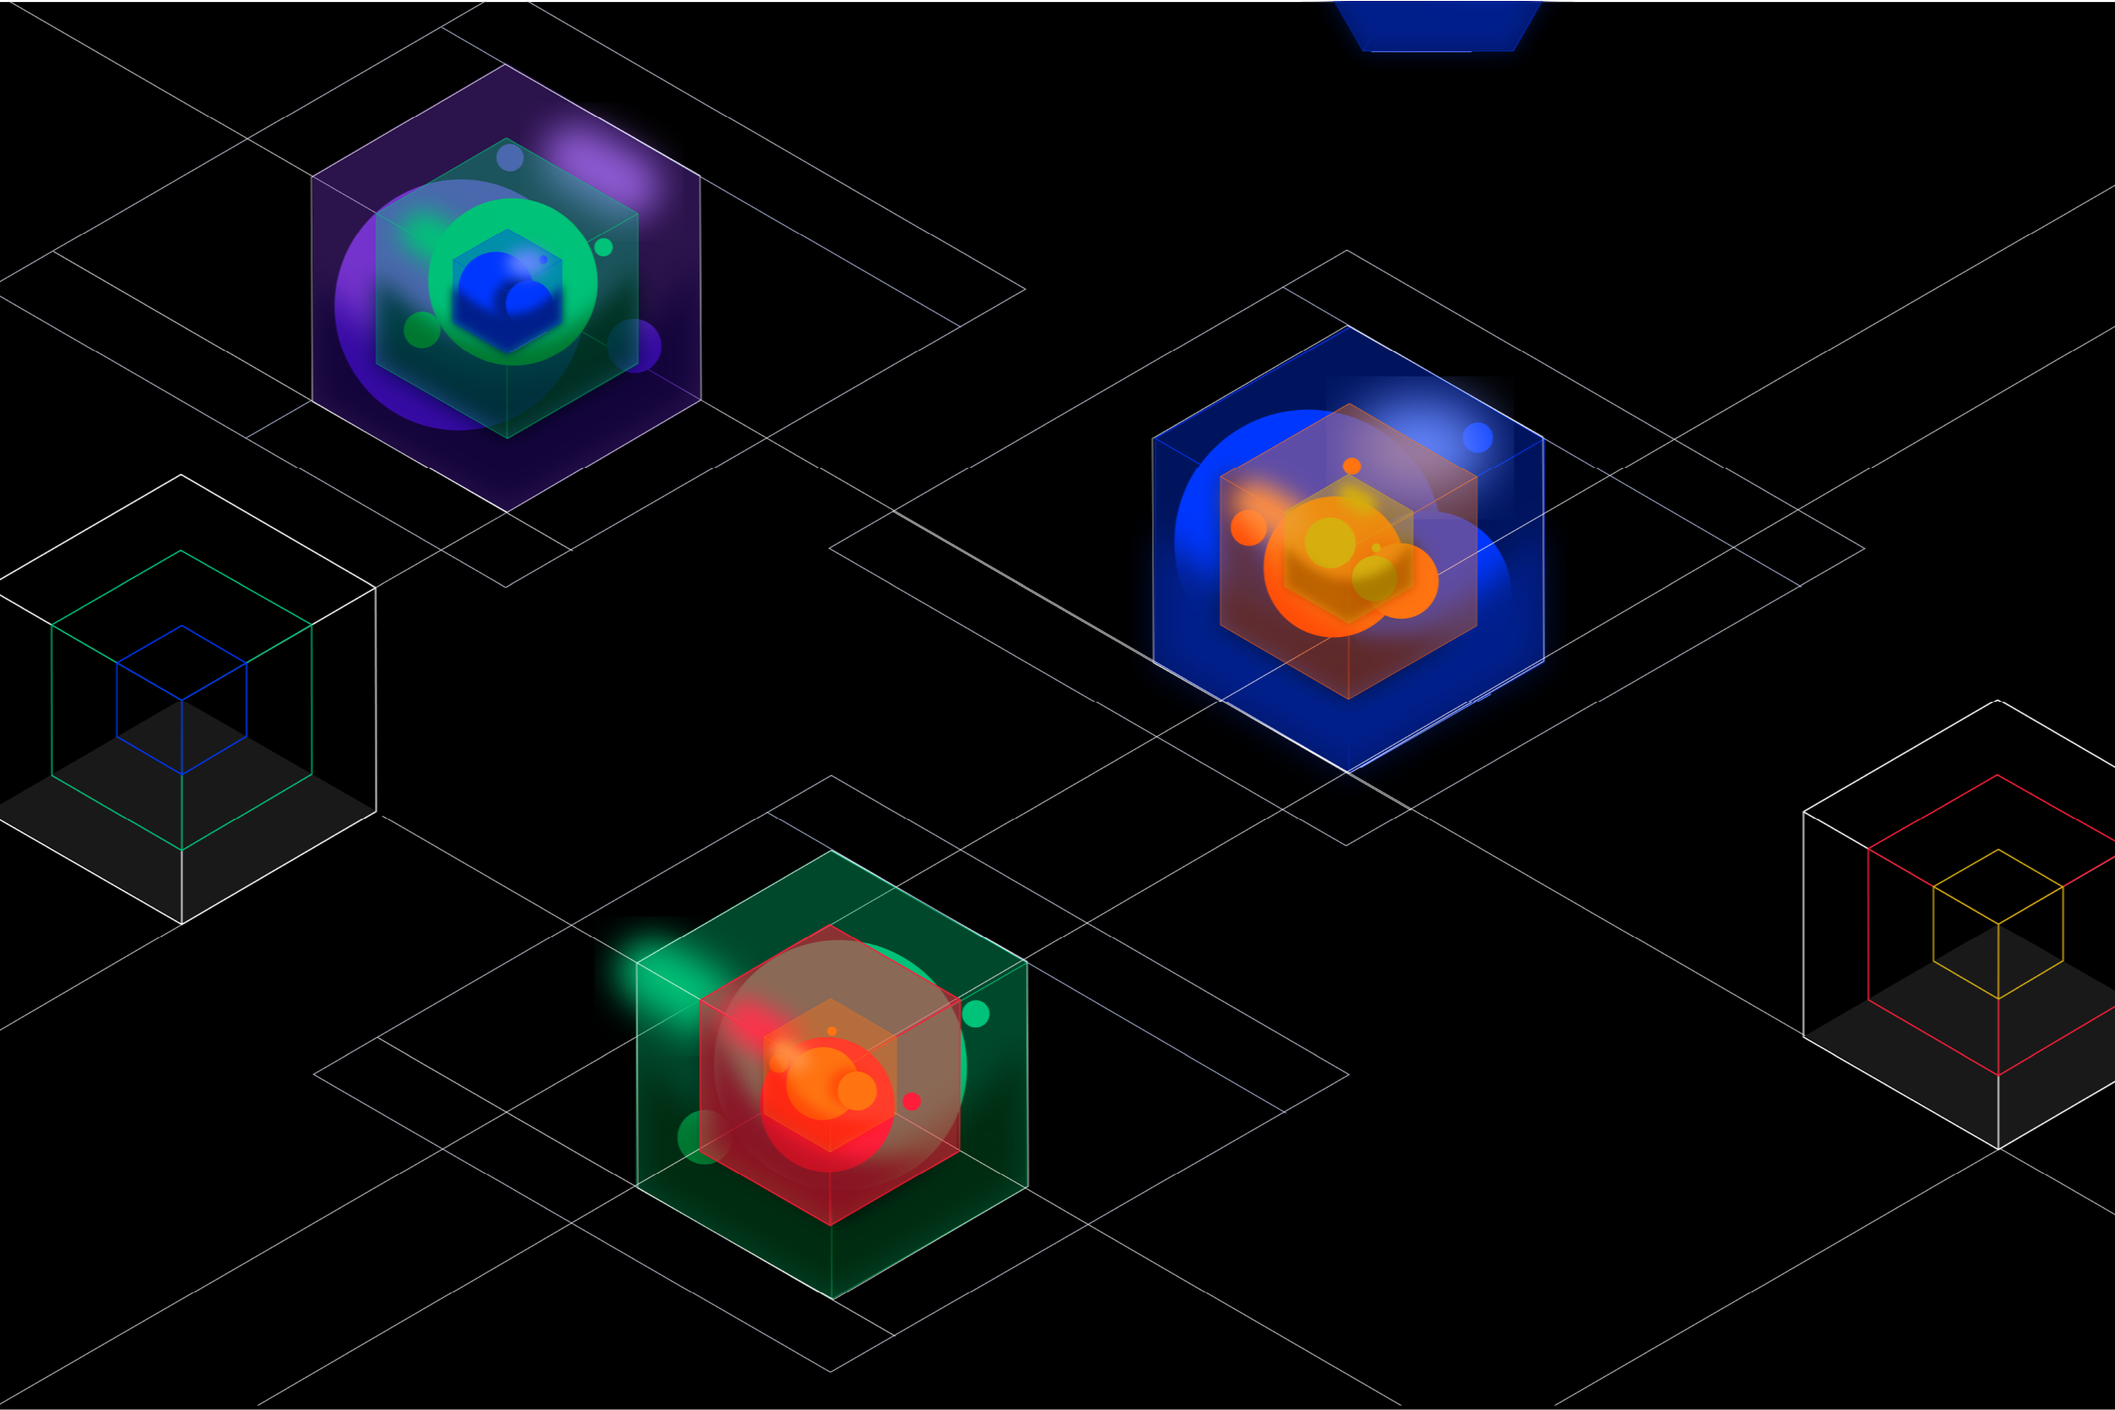
The narrative focuses on how data evolves into knowledge. It follows microscopic data points as they connect, merge, and transform into meaningful information that contributes to knowledge on a much larger scale.
To visualize this journey, I used geometric shapes and an isometric perspective. At the time, the white grid on a black background was one of o9’s key brand elements. Because this visual language also appears frequently in sci-fi films and digital-environment interpretations, I leaned into it as the foundation of the world we built. This allowed the story to feel both futuristic and authentically tied to the o9 brand.